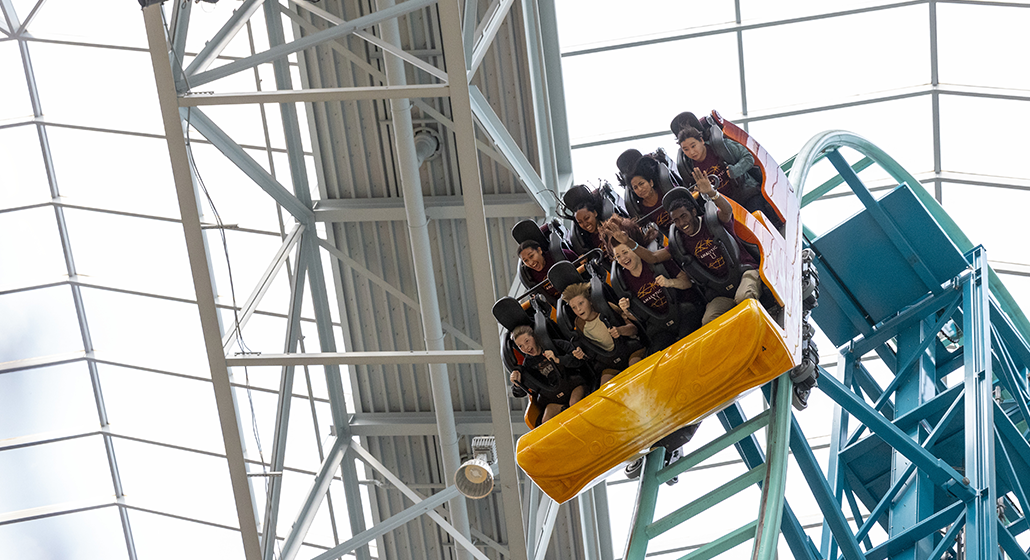
It’s a bustling morning at the Mall of America: toddlers and teens, parents and grandparents weaving through the Nickelodeon Universe indoor park. From every corner, bright yellows, brassy blues, and Ninja Turtle greens create a visual collage as children skip from rides to snack bars to face painters. Groups and families make their way onto and through rides: Paw Patrol Adventure Bay, mini golf courses, and something huge called “Shredder’s Mutant Masher” where riders are flipped into the sky. Most riders strap in, raise their arms, and prepare to scream.
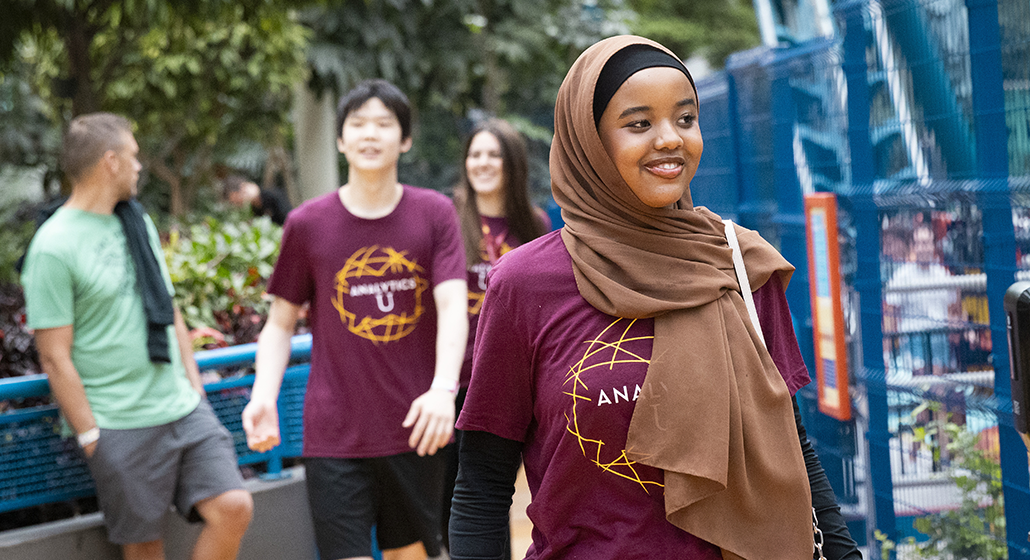
A group of teenagers wearing wristbands enter the scene, led by an intrepid group of educators from the University of Minnesota’s Carlson School of Management and backed by 3M’s generous support. The Carlson School team is here to have fun but they’re also here on a mission. The high school students are part of Analytics U, a week-long pathway program for high school students, designed to introduce them to how data science can play a critical role in solving real-world problems that impact our everyday lives.
Analytics U: 2023
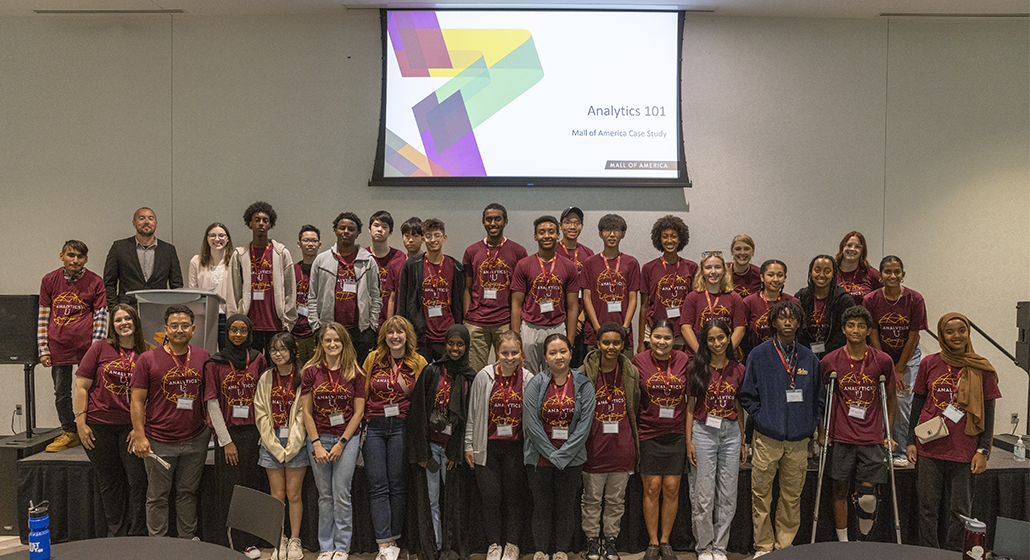
During the 2023 summer program in early August, the Analytics U participants have a complex task: to analyze and interpret the story each set of ride data is telling and present their findings to mall executives. Nickelodeon Universe supplies the data: number of riders, ages of riders, time of day rides are most frequently in use, and what rides attract particular age groups. For the 30 high school students in Analytics U, it’s a fun proposition.
Jeff Williams is the new coordinator for Analytics U, one hat he wears as coordinator for diversity pathway initiatives and community partnerships at the Carlson School. “During the week, students are analyzing the ride data from Nickelodeon Universe, but they’re also meeting with faculty, doing a Q & A with current undergraduate business students, site visits, touring campus, and preparing for their week’s end presentation. It’s a busy week!” They work in small groups of four to five students, led by Carlson School staff through a custom-designed course they call Analytics 101.
At the end of the week of learning and data analysis, students present their findings to representatives from the Mall of America, several Twin Cities businesses, and Carlson School faculty. “The presentations are my favorite part of the week,” says Williams. “Students are really nervous but, as they present the data and research they’ve been studying and refining all week, they gain confidence and are able to finish the week on a strong note. The high school students have usually coalesced as a group, practiced teamwork, and have a real-world life cycle of data analysis and storytelling with data under their belts.”
As for the students, a survey at the end of the week revealed their favorite parts of the week were meeting other high school students and engaging with college students. “Of course, they love going to the mall and eating as much food as they want in the cafeteria,” Williams laughs. “But they report enjoying the Q & A with current Carlson School students the most. The high school students really want to discover what college life will be like. How hard are tests? What’s it like living on campus? Do you get to study the things you’re interested in?—those kinds of questions. Our hope is those key interactions will bring them back to the U of M after their high school graduation.”
Where it began
Analytics U, operating under the umbrella of the Carlson Schools’ Analytics for Good Institute, started in Fall 2020, when a Carlson analytics faculty member recognized the need for better pathway programs for high school students from underrepresented backgrounds. Though several pathway programs were in place to guide high school students toward a college education at the Carlson School;, Analytics U was the first of its kind at the school to be designed specifically for students underrepresented in STEM programs at the University. While participation in Analytics U does not guarantee acceptance into the U of M, the camp aims to provide students with exposure to lifelong skills. Through a partnership with 3M, Analytics U was born.
Geida Cleveland, director of diversity, equity, inclusion, and enrollment and scholarship at Carlson, led the program in its first year. “Our program specifically targets underrepresented populations so we’re looking for students of color, low-income students, first-generation students, etc.” Cleveland says. “We’re really excited to have this program again for a second year. We saw a lot of interest—even in the middle of the pandemic we had students wanting to show up to sharpen their skills and get a jump on data analysis as a future opportunity.”
Building a pipeline for tomorrow’s data analysts
Analytics U is one of the many innovative ways the bright minds at the Analytics for Good Institute are working to engage the next generation of learners and leaders in hands-on experience, as they hope to drive high school students toward a decision for higher education and a business education.
“The intersectionality of science, data science, and business is an essential current, underscoring our everyday lives in ways most don’t even realize,” says Cleveland. “Studying data analysis in business is becoming a huge interest for our students—present and future. This program is just the beginning for many of these students as they take these skills and prepare to utilize them in their academic and professional futures.”
After the week at Analytics U is complete, students head back to their respective high schools, equipped with a new skill set and a new passion for storytelling through data analysis. With 3M’s backing, Analytics U will roll out again next summer, with the next set of future data analysts.